
Recently, I had a memory leak in production. I saw that a specific service’s memory steadily rises when under load, until the process hits an out of memory exception. After a thorough investigation, I found out the source of the memory leak as well as the reason to why it happened in the first place. To diagnose the problem, I used Golang’s profiling tool called pprof.
In this post, I will explain what is pprof and show how I diagnosed the memory leak.
Preface
Our clients use our system through a proxy service, to which, we provide access to. The said memory leak happened in the proxy service.
Disclaimer
Some of the images here will be cropped and missing some information due to security reasons.
The Memory Leak
After getting complaints from clients about hiccups and disconnects, I started digging for the problem.
First thing I did, was go into the company’s Grafana and check the memory and cpu of the proxy service.
I looked at the service and compared metrics from 3 different scenarios:
- Service is after restart and idle
- Service is under load
- Service was under load and now idle
All the overlapping lines below are idle instances of the service, only the green line gets traffic.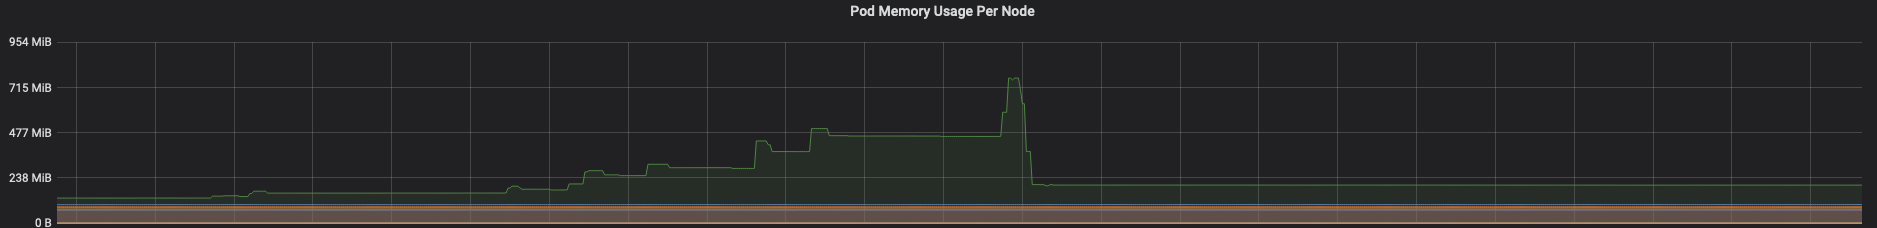
There are a couple of obervations from the image above
- When the service is idle and there is no traffic, its memory stays low
- After traffic stops hitting the single instance, its memory level drops but stays well above the others.
Before jumping on a profiling adventure (some may call it a nightmare), I made a small checklist of things I wanted to exclude:
- I was using Golang version 1.12.5, so I wanted to make sure that the potential leak was not coming from the runtime (even runtimes have issues). A good place to start is by looking at open issues on the github page
- Try agressive garbage collection using debug.SetGCPercent(10)
- Try Manual debug.FreeOSMemory(). Runtimes are all about performance, after memory has been garbage collected, it is not freed back to the OS immediately for performance reasons.
- Try to reproduce the leak in a staging environment with a small load test to confirm my suspicions.
After completing my checklist and seeing the leak was still present and that it was reproducible, I started profiling the service with pprof.
Golang’s Profiling Tool - pprof
From the pproff github page
pprof is a tool for visualization and analysis of profiling data.
pprof reads a collection of profiling samples in profile.proto format and generates reports to visualize and help analyze the data. It can generate both text and graphical reports (through the use of the dot visualization package).
Profiling Types
There are several profiles you can collect
- goroutine - stack traces of all current goroutines
- heap - a sampling of all heap allocations
- threadcreate - stack traces that led to the creation of new OS threads
- block - stack traces that led to blocking on synchronization primitives
- mutex - stack traces of holders of contended mutexes
- profile - cpu profile
- trace - allows collecting all the profiles for a certain duration
Profiling Example
To start the profiling, I imported pprof and started an HTTP server for it.
Note, that if you already have an HTTP server running, the import statement is sufficient.
I had a TCP server running, so I added another goroutine to listen on a separate port for the pprof.
1 | import _ "net/http/pprof" |
For memory leaks, we want to start with the heap profile.
To capture a profile we run curl http://localhost:6060/debug/pprof/heap?seconds=30 > heap.out.
To inspect a profile we run go tool pprof heap.out.
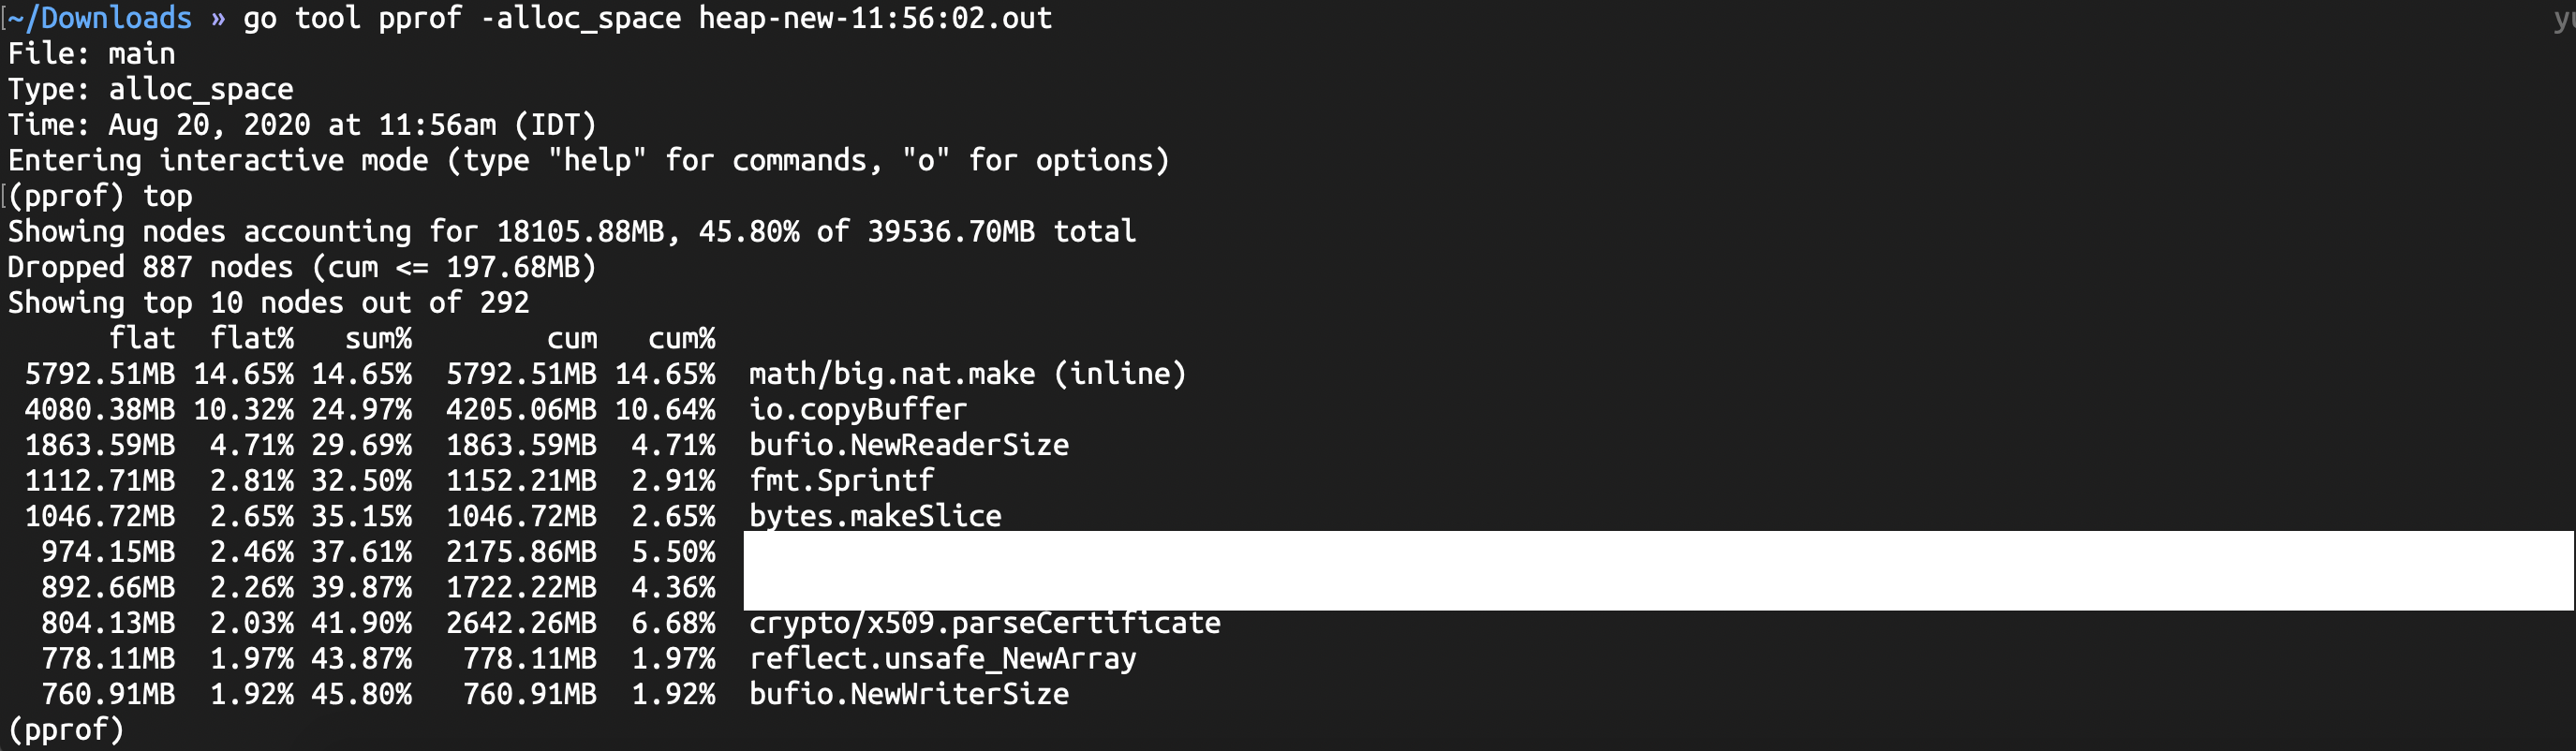
There are two types of allocations the profile will collect
in_use - current allocations
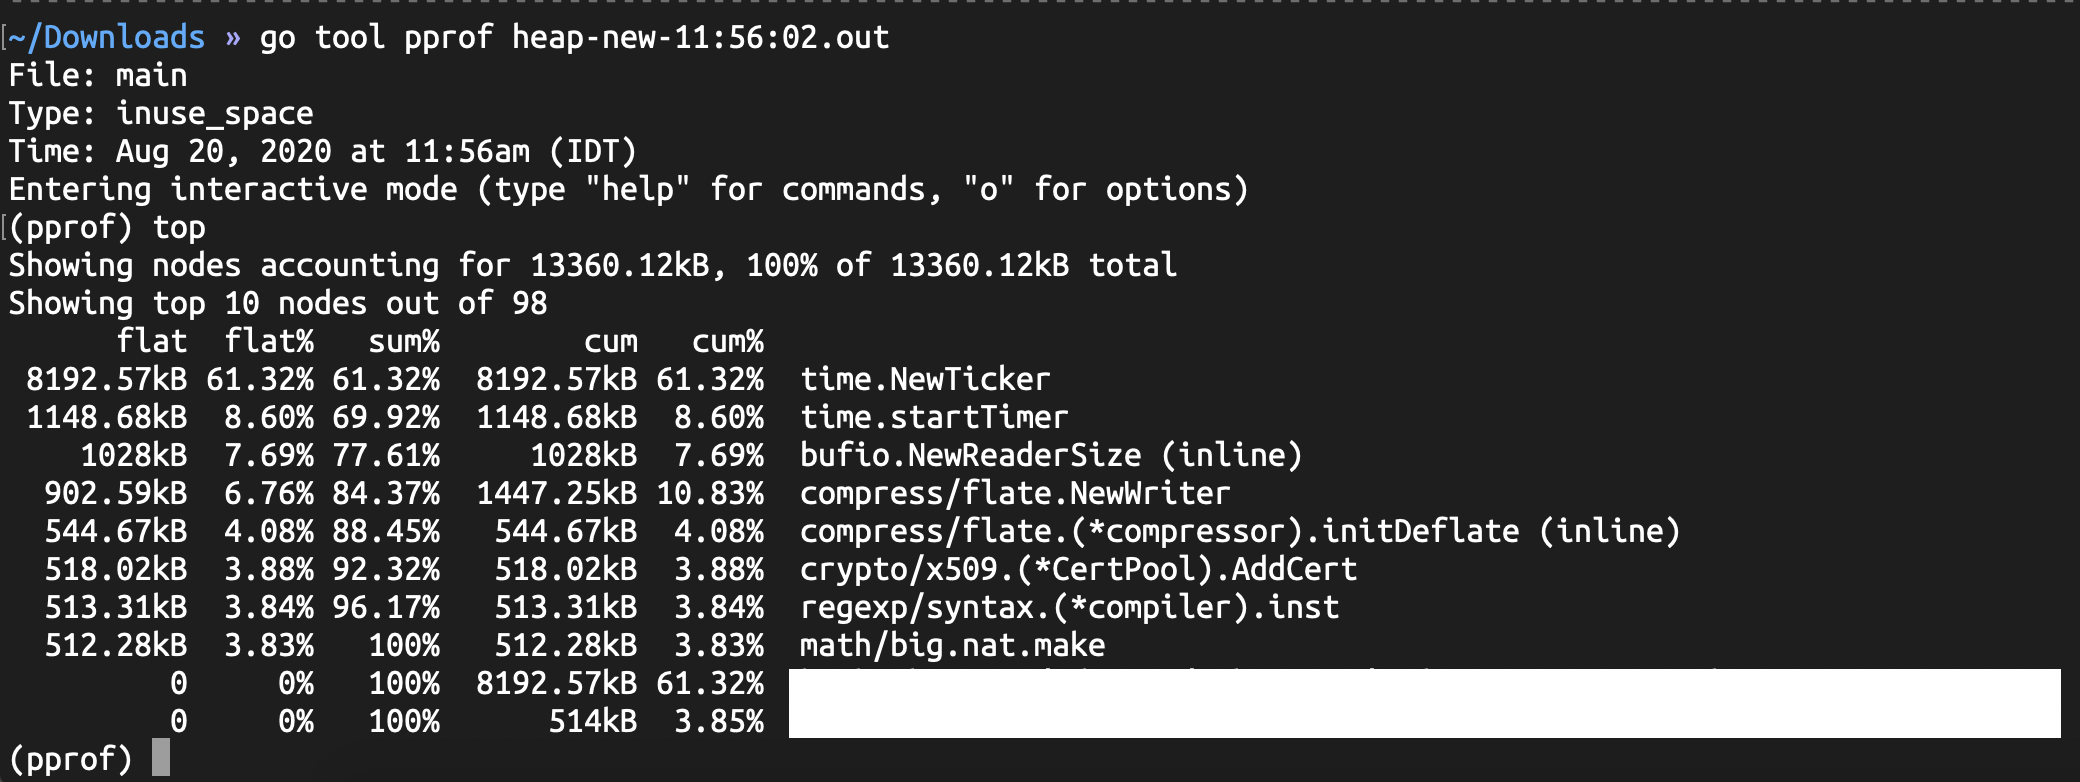
alloc - total allocations since the program started running, regardless of whether the memory was freed or not.
Entering top will display the top 10 results that make up the most memory consumers. We can write any number after top to see the top results.
We have two important fields to look out for
- flat - how much memory is allocated by this function
- cum - how much cumulative memory is allocated by this function or a function it called down the stack
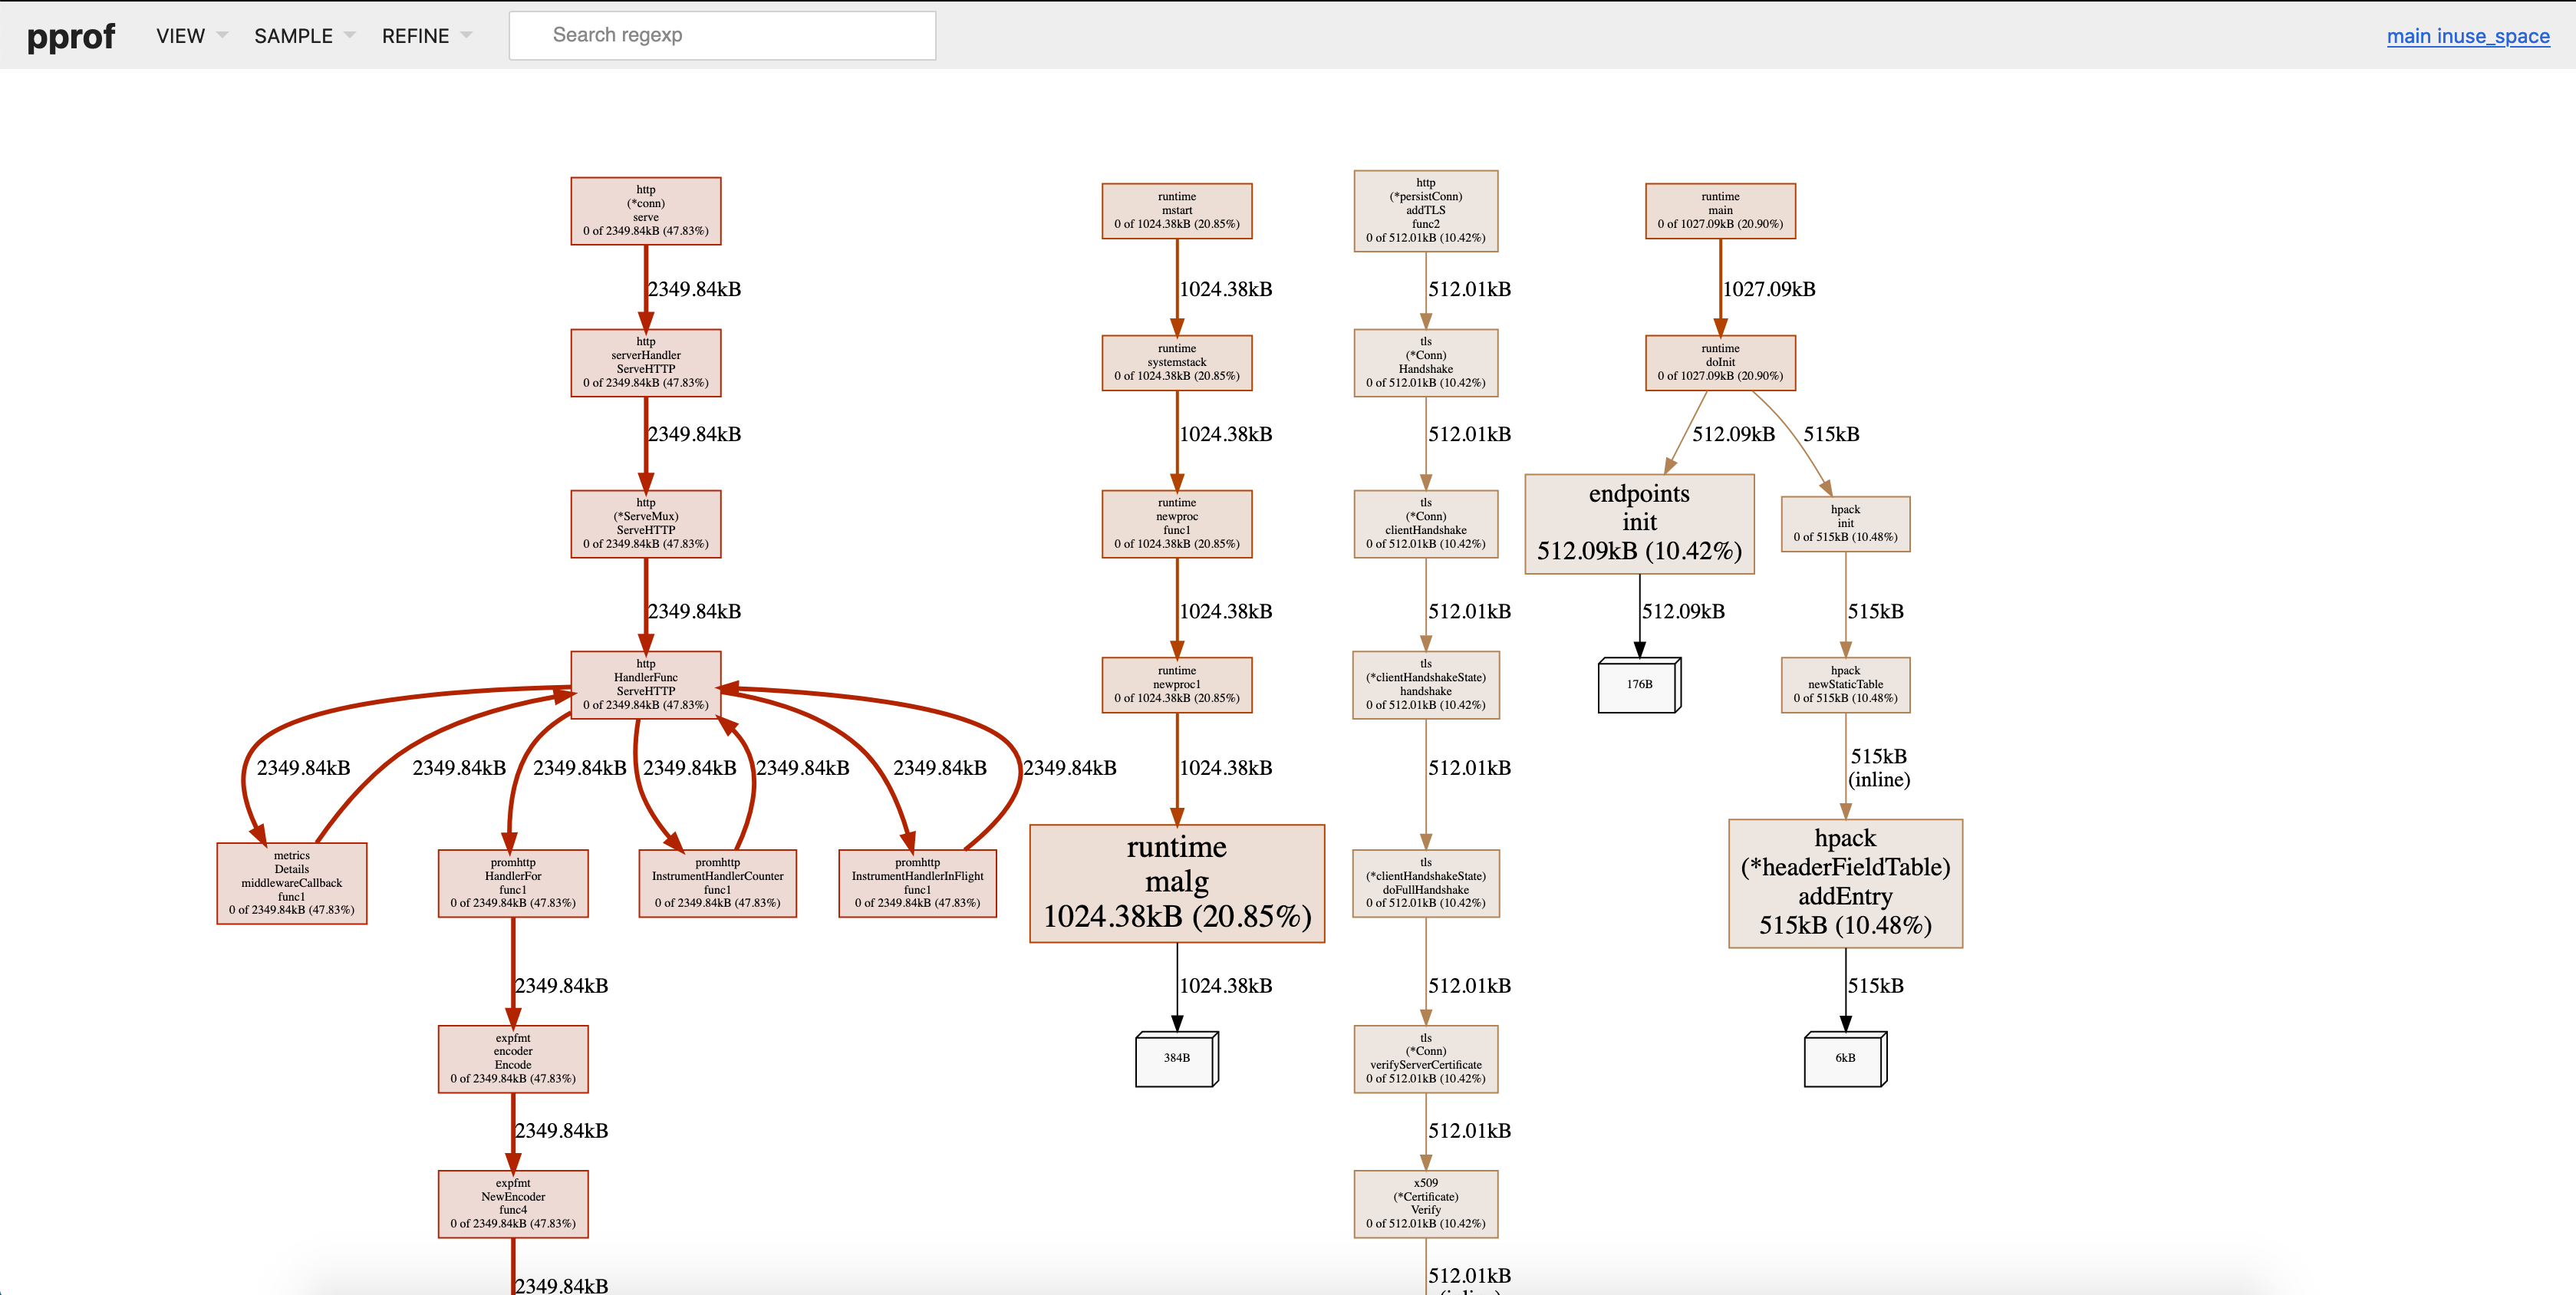
pprof also has a web interface to visually examine the profile.
To run pprof with the web ui run go tool pprof -http=':8081' heap.out, notice the http flag.
The biggest memory consumers in the profile collected will be shown as red, which are your points of reference.
We can see in the image below, that there are two red paths, one for the http server and one for runtime.malg
Diagnosing the Leak
Pprof has another helpful feature that allows comparing profiles using the -base and the -diff_base flags.
We run it like so go tool pprof -http=':8081' -diff_base heap-new-16:22:04:N.out heap-new-17:32:38:N.out
After collecting a 30 second profile before and after a service got traffic, I compared the profiles. Immediately, runtime.malg that grew in memory caught my eye.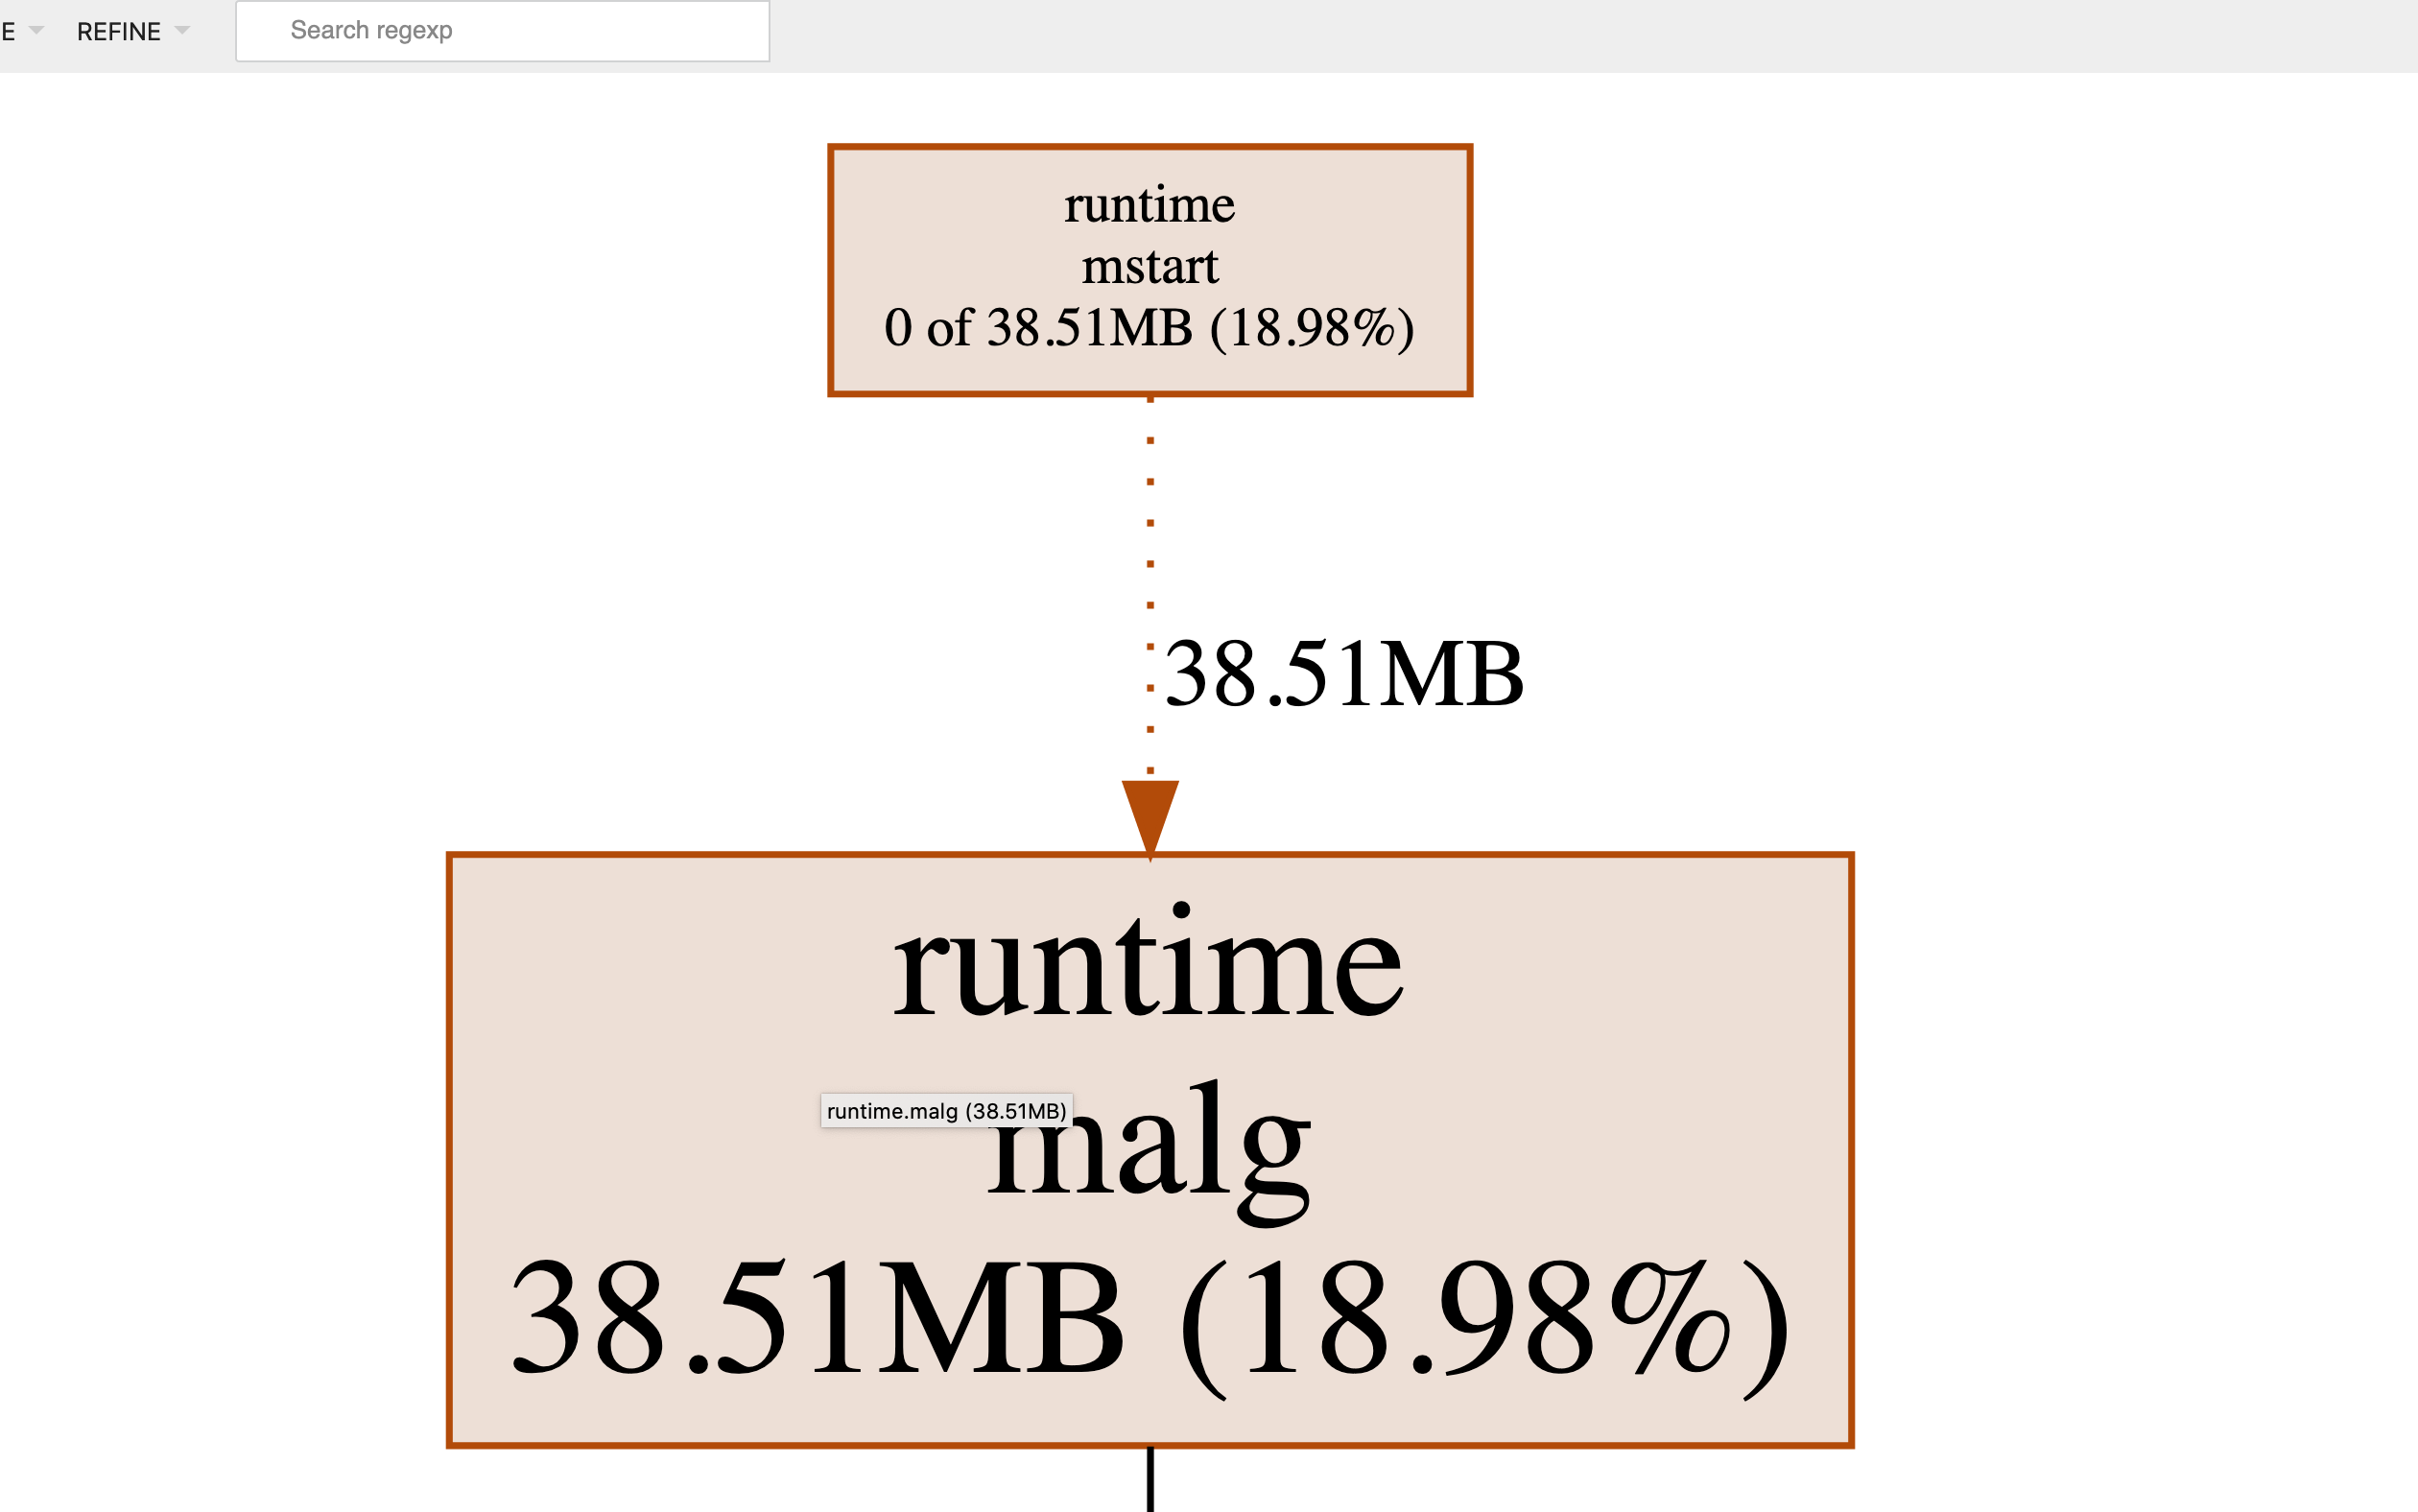
At idle runtime.malg was around 1MB and it grew to 38MB.
When creating a new goroutine the runtime.malg function is called. It allocates a stack trace for the newly created goroutine and holds a reference to it until the goroutine finishes execution.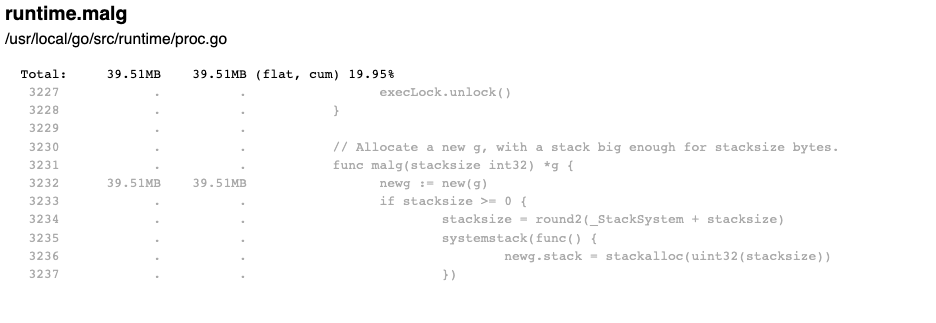
The Fix
By now, pprof pointed me towards runtime.malg, that held all goroutine descriptors, which did not get garbage collected.
A goroutine that is never garbage collected means it never finishes execution, which happens on two occasions
- A
for{}or aselect{}loop without a stopping condition - A
channelthat waits for messages and is not getting closed properly
To confirm my suspicions, I took a goroutine profile, which looked like this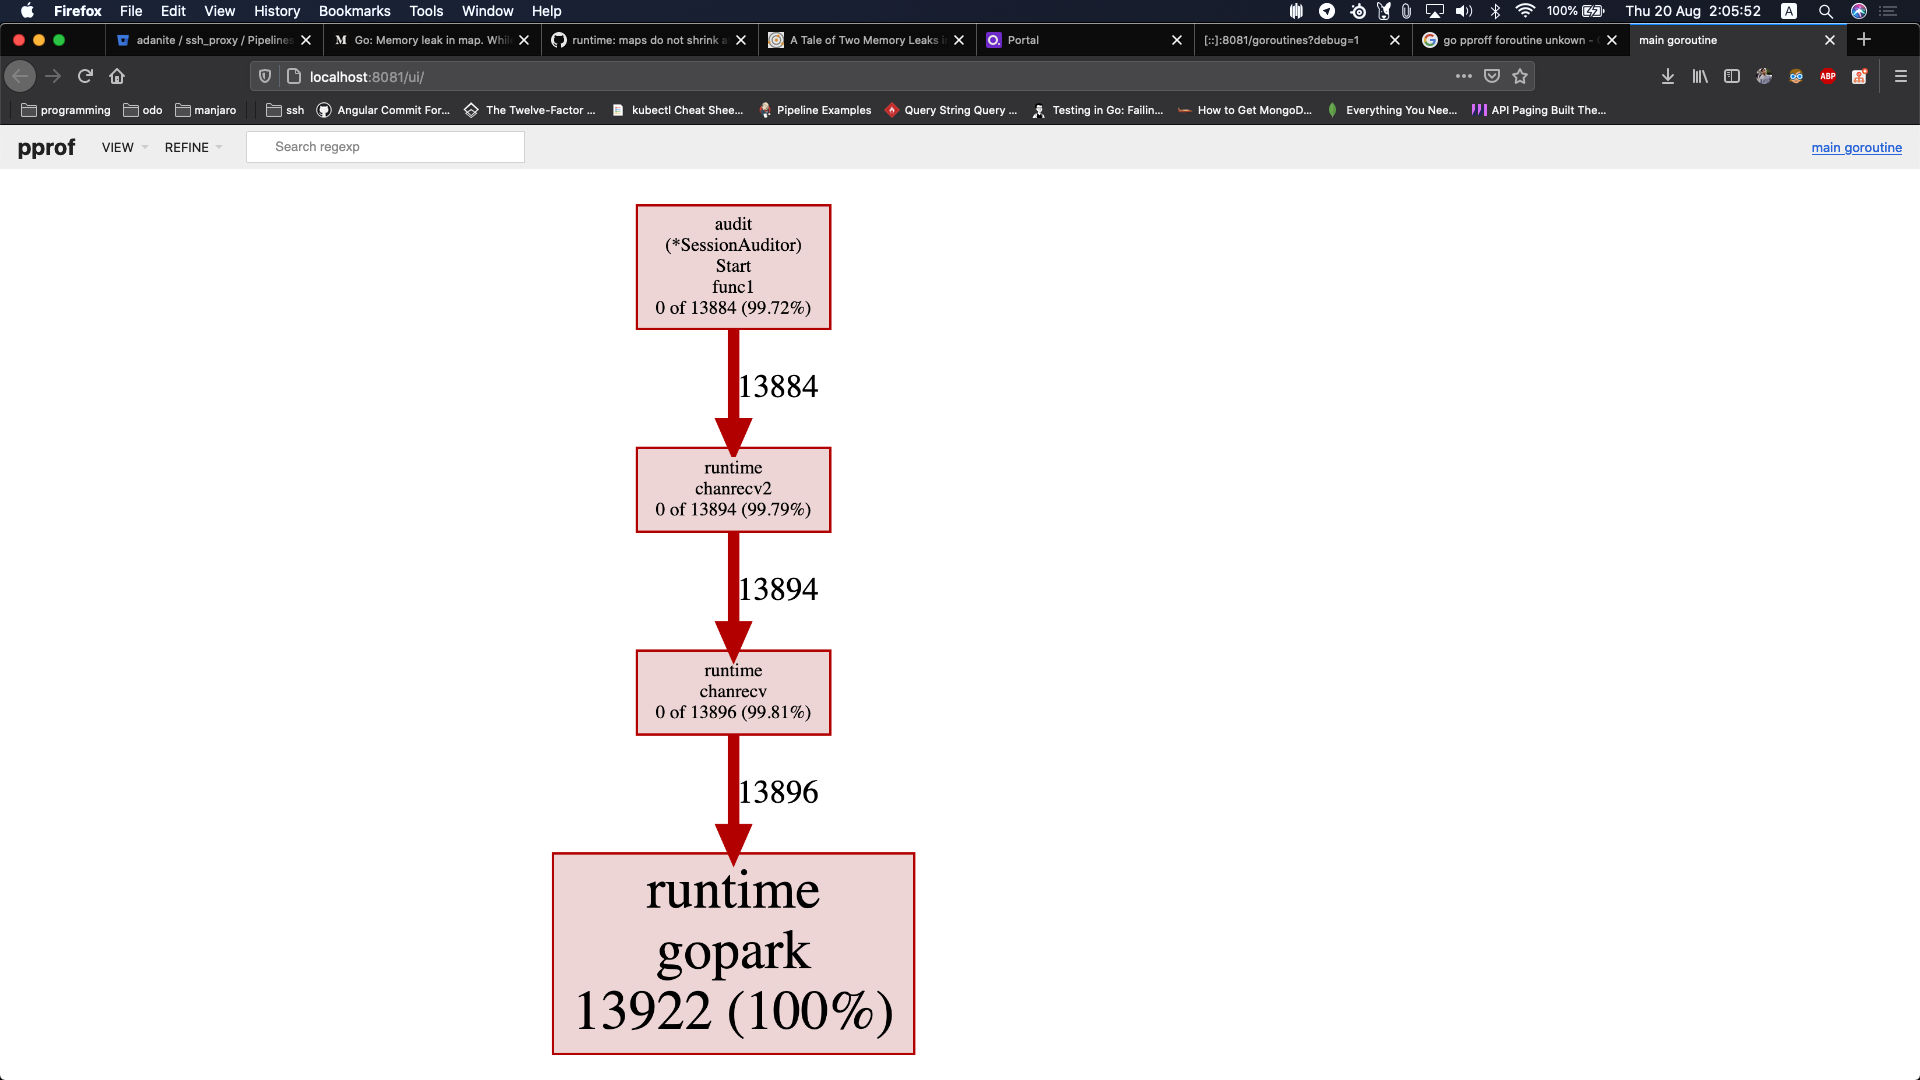
The profile above shows that I have a lot of goroutines spawned that are doing nothing , because they are waiting on a channel.
I immediately looked at the piece of code that the profile above points at and found the following
1 | go func() { |
The goroutine has a for loop which always listens on a channel from time.Ticker.
Checking how the stopping of the time.Ticker occurs looks like this
1 | sa.reader.Stop() |
Looking at the documentation of time.Ticker, I noticed this
Stop turns off a ticker. After Stop, no more ticks will be sent.
Stop does not close the channel, to prevent a concurrent goroutine reading from the channel from seeing an erroneous “tick”.
It immediately struck me, the channel is never getting closed, which leaves the goroutine in a waiting state forever, which leads to the runtime.malg to accumulate gouroutine descriptors, which increases the heap until we reach OOM exception.
I added a done channel to the goroutine and made sure to close it on ticker.Stop()
1 | |
Summary
The memory leak above turned out to be a forgotten channel that caused a goroutine leak. A goroutine leak happens when goroutines never finish execution, which leads to their stack stay on the heap and never get garbage collected, which eventually leads to an out of memory exception.
The cause of memory leaks will almost always be from your applications side, but as I crunched through several of them, I noticed it is easier to start with the small things, like, checking the runtime Github page for new issues, or, if the leak started after a new release, comparing it to a previous release without the leak. These small things can save you tens if not hundreds of profiling hours. Regardless of where you choose to start, pprof can come to your aid. Pprof is Golang’s profiling tool which allows you to take cpu, heap, OS thread and goroutines profiles and compare them visually.